 GEMOC ARC National Key Centre
TerraneChron®
TerraneChron® is GEMOC's unique methodology for terrane evaluation. During 2009 a range of new studies, including collaborative research projects with industry, using TerraneChron® expanded our knowledge of crustal evolution and the timing of tectonic events.
A novel linking of geochemical and geophysical data to resolve thermal and compositional structures of the Earth's upper mantle
The determination of the thermal and compositional structures of the Earth's mantle in space and time is a fundamental goal of modern geophysical modelling. These data are the basis for any evolutionary model of the Earth, as well as for understanding the relationships between geophysical observables (e.g., gravity, seismic velocity) and the physical state of the Earth's interior. They also provide critical information on how the lithospheric-sublithospheric system would respond to perturbations arising from tectonic shortening, rifting and sublithospheric convection. Much of our current knowledge about the present-day thermal and compositional structure of the lithospheric and sublithospheric upper mantle has been based on three independent approaches: i) modelling of geophysical observables such as gravity, surface heat flow (SHF), elevation, or some combination of these; ii) interpretation of seismic data using an appropriate combination of "observed" seismic velocities (usually shear waves) with mineral physics, laboratory data, and thermodynamic concepts; ii) geochemical and thermobarometry studies of mantle xenoliths (see GEMOC publications #521 and 622). If the assumptions behind all these methods were correct, any modelled section of upper mantle should produce consistent results, no matter which methodology is applied. However, large discrepancies between predictions from these three different methods still are the rule rather than the exception (see GEMOC publication #521).
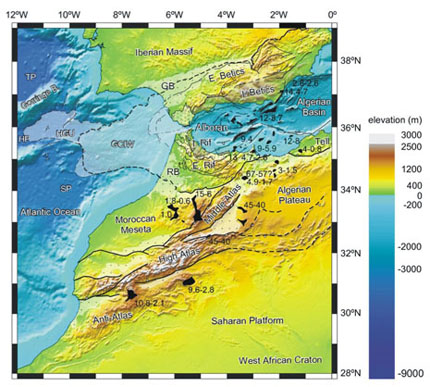
Figure 1. Elevation map with the principal tectonic domains of the Betics, Rif and Atlas Mountain belts, together with the Cenozoic volcanic rocks (black areas) and their age. Cenozoic sedimentary basins are depicted by dotted areas. Guadalquivir Basin (GB), Rharb Basins (RB), Gulf of Cadiz Imbricated Wedge (GCIW), Horseshoe Gravitational Unit (HGU), Seine (SP), Horseshoe (HP) and Tagus (TP) abyssal plains.
One way to overcome these difficulties and obtain more consistent and robust models is to fit simultaneously and self-consistently all the available geophysical and petrological observables (i.e., gravity anomalies, geoid height, SHF, electrical conductivity, seismic velocities, xenolith data and elevation). A simultaneous fit of all these observables reduces the uncertainties associated with the modelling of each of them alone, or with the combinations of pairs commonly used in the literature (see above). It also allows us to distinguish, and have a better control on, thermal or compositional density variations at different depths, since these observables are differently sensitive to shallow/deep, thermal/compositional density anomalies. However, an integrated modelling approach that can include all of these parameters in a self-consistent manner represents a major technological and conceptual challenge. Current research at GEMOC attempts to fill this gap by developing and applying a new integrated geophysical-petrological methodology based on a robust and consistent combination of thermodynamic and physical models. The first full 3D forward version has been recently applied to the Atlantic-Mediterranean Transition Region (AMTR, see GEMOC publication #627), and the main results are summarised here.
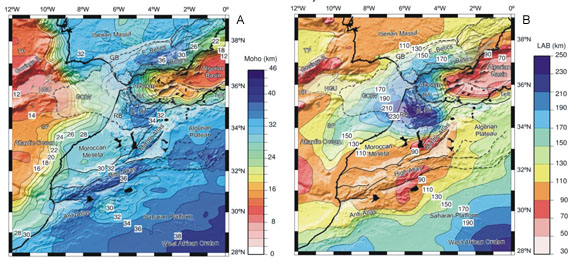
Figure 2. A) Moho depth map superimposed on the structural map with the main tectonic units and volcanism (see Fig. 1). Isolines every 2 km. B) Map of the depth to the Lithosphere-asthenosphere boundary superimposed on the structural map with the main tectonic units and volcanism. Isolines every 20 km.
The AMTR comprises a narrow region along the transition between the western Mediterranean and the Atlantic Ocean along the westernmost segment of the African-Eurasian plate boundary (Fig. 1). It is characterised by a diffuse transpressive contact between the African and Eurasian plates, including a wide band of active deformation. Traditionally, the AMTR has been considered as a zone comprising the Alboran Basin, the Betic and Rif orogens, and the Gulf of Cadiz (Fig. 1). However, some authors have included the adjacent Atlas Mountains on the basis of the similarities in the type and ages of the lavas in south-eastern Iberia and north-western Africa, including the Atlas.
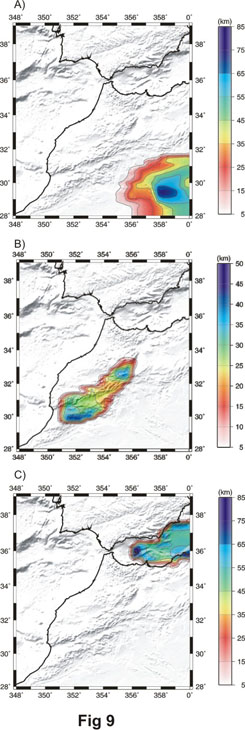 Maps of the depths to the LAB and the crust-mantle boundary of our final best fitting model are shown in Figure 2. The depth of the crust-mantle boundary shows a very heterogeneous crust in the modelled region, with thickness variations of > 25 km. The resulting LAB topography is characterised by strong lateral gradients in the northern, southern and eastern limits of the thick lithosphere imaged beneath the Gulf of Cadiz, the Betics and the Rif (170-240 km). These regions coincide with the contact between the Iberian Variscan Massif and the Betic chain in the north, the contact between the Middle Atlas and the external Rif domain to the south, and the contact between the Betic-Rif orogen and the Alboran Basin to the east. This lithospheric thickening, with a reduced magnitude, continues to the southwest, encompassing the NW Moroccan margin (140-170 km). The thinnest lithosphere obtained in this model is in the eastern Alboran Basin, where the LAB depth is about 70 km. Moderate lithospheric thicknesses are obtained in the SW Iberian Variscan Massif (90 km) and the Atlas Mountains, particularly in the central High Atlas and eastern Anti Atlas (90 km), and the Middle Atlas (<80 km). The eastern branch of the Atlas does not seem to be affected by a lithospheric thinning. The lack of a spatial correlation between the thicknesses of the crust and lithospheric mantle (Fig. 2) in large parts of the model suggests a previously unrecognised decoupling of these two layers. Whereas the Moho depth map essentially mimics topography, with maximum values beneath the Eastern Betics, Rif and Atlas mountains, the LAB map shows a remarkably different pattern, with NE-SW thickening along the western Betics, Rif, Rharb Basin, and Moroccan Atlantic margin, and thinning along the Eastern Alboran Basin and Middle, High and Anti Atlas. It is therefore likely that this lack of a thickness correlation results from the overlapping of different tectonic processes, which incorporate a sub-lithospheric component (see GEMOC publication #627).
Figure 3. Thickness map of anomalous mantle layers (i.e. mantle domains with different compositions from the background mantle). All layers are defined from the Moho depth downwards. A) West African Craton/Mobile Belt. B) Atlas Mountains. C) Alboran Basin.
Interestingly, most of the Miocene mafic lavas (Fig. 1) seem to be spatially related to regions where the lithospheric mantle has been thinned (Fig. 2), suggesting a causal relationship between mantle upwelling and alkaline magmatism. Geochemical analysis indicates that these magmas have a common mantle source, forming a deep reservoir extending from the Canary Islands to the Western Mediterranean. Therefore mantle melting and alkaline volcanism would be related either to small-scale convection involving the deep reservoir, or to small plumes acting as 'escape valves'. This implies that the thinning beneath some parts of the High Atlas, Middle Atlas and Anti-Atlas is probably responsible for, or related to, the observed alkaline volcanism rather than acting as an effective corridor through which magma displaces laterally from a unique reservoir located in the Canary Islands.
Our analysis indicates that the average bulk composition of the lithospheric mantle corresponds to that of a typical Tecton (i.e. Phanerozoic) domain, with the exceptions of the Sahara Platform, the Alboran Basin, and Atlas Mountains. The presence of these distinct lithospheric domains (Fig. 3) is required to reduce the residuals between measured and calculated regional observables such as gravity, geoid and elevation. These heterogeneities are related to either secular compositional variations (Sahara Platform) or recent mantle metasomatism (Atlas Mountains and Alboran Basin), and allow a fairly good reproduction of the measured Pn-velocities of the uppermost mantle and the regional travel-time tomography models (Fig. 4). 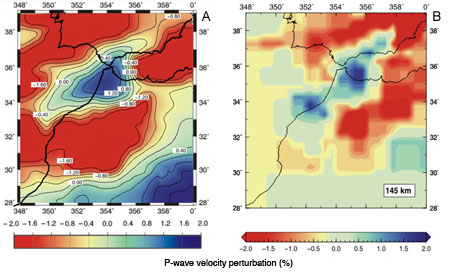
Figure 4. A) Synthetic P-wave velocity anomalies predicted from our model at 145 km depth. B) Horizontal slice of P-wave velocity anomaly obtained from a seismic tomography study (Villaseñor et al., 2003).
Although our methodology represents the first petrological-geophysical self-consistent approach in 3D, it still is a forward method (based on a recursive run of user-guided forward models). The non-linearity of the physical problems involved (see GEMOC publication #605) means that any true inversion scheme must be based on either systematic or stochastic exploration of the parameter space, i.e. running several successive forward models. In the 3D case, the high number of degrees of freedom (e.g. the petrophysical and compositional parameters of each body, and the depth of each node defining the limits of the layers), as well as the relatively long time required to run each forward model (~30 min), makes the inversion approach unviable at present. However, preliminary results indicate that a sophisticated combined forward-inversion technique is possible. This will make the modelling process much easier, and will provide a robust means to evaluate uncertainties as well as allowing us to model larger regions of the Earth.
Contact: Juan Carlos Afonso
Funding: Macquarie University
Heat, light and energy - Geothermal resources in Eastern Australia's Basins
Coal from the sydney-gunnedah-bowen basin system has been a major resource for Australia's energy industry for the better part of a century, supplying the largest percentage of NSW's base-load power. More recently, developments in the extraction of methane and natural gas from coal beds has seen a resurgence of interest in these deposits.
 The move from a fossil-fuel based energy system to a renewable energy economy will involve a range of energy solutions, and one of the most promising for delivering base-load power is geothermal energy.
Traditionally, geothermal industries have focussed on the exploitation of obvious, near-surface energy sources, such as active volcanic fields; examples are New Zealand and Iceland. However, advances in scientific drilling have seen deeper levels of the crust become viable heat sources, and some of the most prospective areas in Australian are within sedimentary basins.
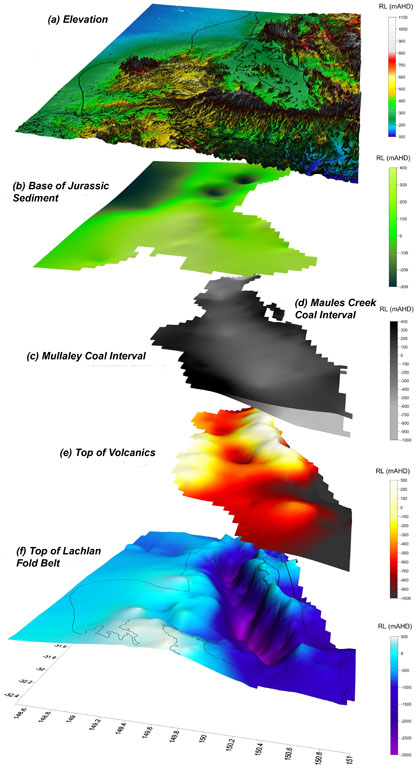
Figure 1. Architecture of the Gunnedah Basin, viewed from the south. Stacked model 3D surfaces of the Gunnedah Basin (in mAHD), blanked to their approximate extent. (a) Elevation with basin outline; (b) Base of Jurassic sediment; (c) Top and base of the Permian Mullaley Basin coal interval; (d) Top and base of the Permian Maules Creek Coal interval; (e) Top of rift volcanics; (f) Top of Lachlan Fold Belt basement with Gunnedah Basin outline.
While commercial interest recently has been focussed on the extraordinarily hot Cooper Basin in central Australia, many of Australia's East-coast basins have the advantage of being near the largest population centres. The connected Sydney-Gunnedah-Bowen Basin system is one of the largest tectonic basin systems in Australia, and in places it contains extremely thick sedimentary sequences, ideal areas for trapping crustal heat at depth.
Recent work at GEMOC has been aimed at developing crustal-scale models of the architecture of the Sydney and Gunnedah system. These models, combining information from hundreds of drill cores and detailed gravity modelling, incorporate detailed lithological information on the sedimentary pile and have constrained the structure of the basin in 3D at an unprecedented scale. These models have become the basis for thermal models of the sedimentary basin system. Existing geodynamic codes have been 'rewired' to import complex geological models; coupled with sparse thermal constraints available in parts of the basin, these show the detailed 3D thermal structure of these systems.
These results have been surprising. Conventional wisdom holds that the highest temperatures would be found directly beneath the thickest sedimentary "blanket", but these simulations suggest that instead the lateral temperature gradients within a basin cause heat to refract around such layers. Heat preferentially goes around a coal layer, for instance, rather than through it. In addition, large gradients in the basement are also the sites of elevated temperatures at depth, as heat preferentially moves around the thick insulating blanket of basin sediments. The results also show a lower correlation between surface heat flow and temperatures at depth than commonly assumed, often due to these lateral geometric effects. Heat flow measurements over a coal layer, for instance, may be low, despite high temperatures beneath the insulating coal layer. Without detailed thermal modelling, it is difficult to extrapolate shallow temperature measurements to depth.
This project is currently expanding into the Bowen Basin, and will soon be able to address the thermal history of these basins through time, which has clear potential for the coal/gas maturation history. Additionally, such detailed thermo-structural models will enable us to constrain the stress state of these basins in greater detail - relevant to intraplate earthquakes in areas such as Newcastle. The detailed thermal and sedimentary structure models will also enable us to simulate the deep, hot aquifers of such basins - identified as a potential geothermal resource in their own right, and also an important and under-appreciated factor in basin-scale groundwater systems.
Figure 2. Temperature at the top of the Lachlan Fold Belt Basement, draped over basin architecture.
Contacts: Craig O'Neill, Cara Danis
Funding: ARC Discovery, APA
Hot, cold, or different? New constraints to interpret upper mantle seismic data
The seismological structure of the earth's upper mantle is highly heterogeneous, and much of this heterogeneity reflects the lithosphere's thermal and compositional structure. Since lithospheric discontinuities commonly correlate with the location of seismically active zones, major tectonic boundaries, foci of magma intrusion and major ore deposits (see GEMOC Publication #547), their detection is important for ore and energy exploration and natural hazard assessment. However, limitations on resolution, and trade-offs between temperature and composition complicate the seismological characterisation of the small-scale (ca 300 km) distribution of compositional and thermal anomalies in the upper mantle.
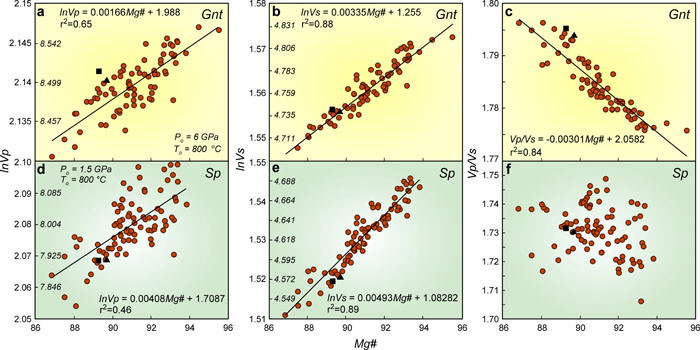
Fig. 1: Seismic velocities versus bulk Mg#. a, b, c Vp, Vs, and Vp/Vs versus bulk Mg# for peridotites within the garnet (Gnt) stability field. d, e, f Vp, Vs, and Vp/Vs versus bulk Mg# for peridotites within the spinel (Sp) stability field. Numbers within the boxes are absolute velocity values in km s-1.
A fundamental problem is the lack of reliable quantitative relationships or indicators (derived from seismic data) that can distinguish between compositional and thermal contributions to variations in seismic velocity. In this context, parameters such as the ratio of compressional-wave to shear-wave velocity (Vp/Vs) or the Poisson's ratio are commonly thought to be reliable indicators of compositional variations in peridotites. Although these parameters have been successfully applied at crustal P-T-X conditions (where X is composition), their extension to general upper mantle conditions has serious limitations due to the effects of temperature-dependent non-elastic behaviour and phase stability.
In order to give some insights into these problems we have carried out a systematic assessment of the effects of temperature and composition on densities and seismic velocities in peridotites, applying thermodynamically self-consistent and hybrid methods, the latest mineral physics databases, and experimental results on the non-elastic behaviour of olivine aggregates at seismic frequencies (see GEMOC Publications #521, 542, 605, 622, 627). We have used a xenolith dataset that spans a range of composition (Mg# values from ~ 88 to 95) covering most of the expected variability within the lithospheric mantle.
Figures 1d, e and f illustrate the compositional dependence of Vp, Vs, and Vp/Vs within the spinel stability field. Although the general behaviour of both Vp and Vs with Mg# is similar to that observed within the garnet stability field, Vp/Vs shows no apparent correlation. Since spinel is stable in peridotitic rocks to depths of ~ 50-60 km under most circumstances, and down to ~ 100 km in strongly depleted rocks, we cannot apply correlations derived for garnet-bearing peridotites in seismic studies of the uppermost mantle.
We have analysed different anomaly ratios from our data set and find that ρ/Vs (where ρ is density) displays the best correlation with Mg# (Figs. 2a, b). Furthermore, the ratio between the compositional and thermal (anharmonic) derivatives of ρ/Vs is similar to, but more reliable than (i.e. less scatter), the Vp/Vs case. Although ρ/Vp also correlates well with composition (particularly in the case of garnet-bearing assemblages; Figs. 2c, d), our results reveal several previously unrecognised advantages of using ρ/Vs rather than ρ/Vp as a general indicator of compositional anomalies. Foremost among these are (i) the greater sensitivity of Vs to temperature variations; (ii) the larger compositional derivative of ρ/Vs; (iii) the smaller scatter of ρ/Vs in the spinel field; and (iv) the similarity in the anharmonic derivatives ∂ (ρ/Vs)/∂ Mg# and ∂ (ρ/Vs)/∂ T of both spinel- and garnet-bearing assemblages. While the first two factors ensure a better response to temperature and compositional variations, respectively, the last two eliminate the problem of phase stability. Despite these advantages, the indicator ∂ lnρ/∂ lnVs is also affected by attenuation, although considerably less than Vp/Vs, as discussed below.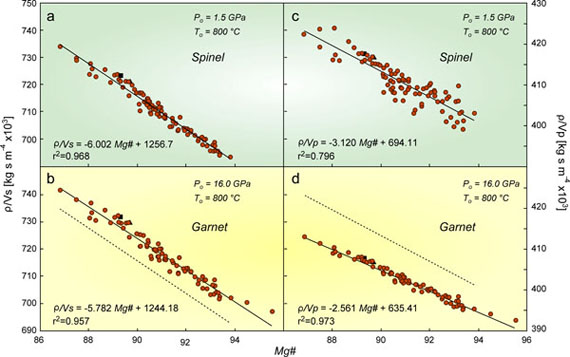
Figure 2. A, B, Ratio of density to shear wave velocity [kg s m-4 x10⁻³] versus bulk Mg# for the same samples shown in Fig. 1. The correlation is significant (r2 > 0.9) in both spinel and garnet stability fields. The derivative ∂(ρ/Vs)/∂Mg# is remarkably similar in both fields. This is clearly visible when the two regression lines are plotted in the same panel, as done in B (the dashed line is the regression line from A). C, D, Ratio of density to compressional wave velocity (absolute values) versus bulk Mg#. Note that although the correlation is significantly poorer than in the ρ /Vs case within the spinel stability field, it is slightly better (greater r2) in the garnet stability field.
The anelastic behaviour responsible for seismic wave attenuation becomes important in olivine-rich rocks at temperatures ~> 900 °C. Since all of the sublithospheric UM and up to 40% of the subcontinental lithospheric mantle have temperatures above this limit, any attempt at constraining mantle composition from seismic data must include attenuation effects. Shear waves are more strongly affected by anelasticity than compressional waves, and therefore both Vp/Vs and Poisson's ratio become strongly dependent on temperature at T >~ 900 °C. Figure 3 shows that a change of 300 °C within the anelastic regime translates into a fictitious change of ~ 6-7 units in Mg# if anharmonic estimates are used for the conversion. This change covers the entire range of common peridotitic compositions in the UM. The ratio ρ/Vs is appreciably less sensitive to anelastic effects and therefore gives a smaller fictitious Mg# change (Fig. 3b). However, due to the non-linear effects of temperature on shear modulus, the graphs for both Vp/Vs and ρ/Vs steepen with increasing temperature. Therefore, the common practice of interpreting observed variations of Vp, Vs, and/or Vp/Vs in the UM in terms of compositional variations with no consideration of anelasticity and phase stability is likely to produce erroneous conclusions. 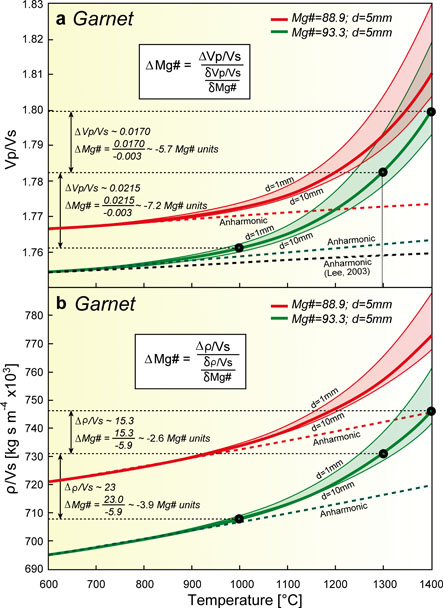
In the light of the above considerations, can we distinguish thermal from compositional anomalies in the UM? The data presented here show that previous models based on seismic parameters produce results that are not meaningful for spinel-bearing peridotites or for olivine-rich assemblages at T >~ 900 °C. On the other hand, the ratio ρ/Vs is a more robust compositional indicator, but requires bulk density as an independent input. Since both density and elastic moduli depend on bulk composition, any model (inverse or forward) of these properties requires a framework that guarantees a self-consistent coupling among P, T and X (bulk and phase). Current joint inversion methods are not well suited because they rely on long-period normal-mode observations, while studies based on the combination of short-period body waves and gravity anomalies model these two geophysical fields through scaling factors and therefore are not self-consistent. Recently-developed techniques that combine geophysical and petrological modelling within a consistent thermodynamic framework
(see GEMOC Publications #605 and 622) are particularly promising, although more detailed studies on the effects of intrinsic attenuation, fluid content and thermodynamic modelling
of mantle assemblages are needed.
Contact: Juan Carlos Afonso
Funded by: Macquarie University, Spanish research projects, NSERC, ARC
Figure 3. A) Vp/Vs versus temperature for two representative samples with Mg# = 88.9 (red colour) and 93.3 (green colour) within the garnet stability field. Reference pressure is Po = 4 GPa. The envelopes enclose Vp/Vs values for grain sizes between 1 and 10 mm. The anharmonic approximation is shown with dashed lines. The black circles denote Vp/Vs values for the same sample (i.e. no change in composition) separated by ΔT = 300 °C (1300 °C – 1000 °C) and 100 °C (1400 °C – 1300 °C) within the anelastic regime. B) ρ/Vs [kg s m-4] versus temperature for the same samples shown in A). The anharmonic behaviour is shown with dashed lines.
Timescale of early core formation: Numerical modelling of liquid metal micro-segregation processes
Our understanding of differentiation events occurring early in the solar system has been greatly enhanced by using short-lived radioisotopes. The rapid decay in these systems gives us fine-scale temporal resolution of melting and differentiation events. Data from the short-lived radioisotope systems suggest that planetary differentiation (represented by iron meteorites which are considered to represent the cores of planetesimals) must have started within ~1.5 Myr of the beginning of the solar system. The results also require that the physical segregation of the core(s) was very rapid. Both percolative flow and deformation-driven flow have been shown to be important in core formation. For a more robust analysis of the speed at which metallic liquid migrated, we need to perform additional numerical studies. We have examined the preserved textures in the Kernouve meteorite (an H6 ordinary chondrite) before and after experimental deformation. The original, static state provides a snapshot of porous flow at the beginning of melting with no applied stress; after experimental deformation the textures show that focused metallic liquid flow has occurred, producing veins of metal in the silicate matrix.
Our modeling results show that the textures in the undeformed rock reflect migration of the metallic liquid by porous flow into high-permeability and low-pressure sites of initial melting and the flow velocity becomes position-dependent. If we modify the matrix permeability in the numerical model, we find that the highest average migration velocities (10-5 m/s) correspond to the highest permeability (10-9 m2). When deformation textures are included in the modeling, channel flow becomes important and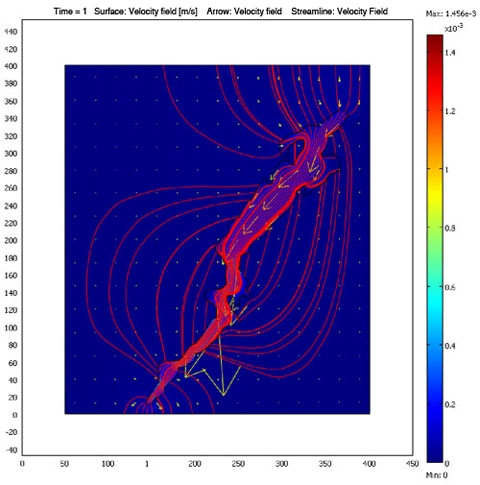 most liquid metal moves through channels (Fig. 1), as demonstrated by the experiments. Under these conditions flow velocities are higher (10-3 m/s). For a planetesimal 200 km across, metallic iron can segregate within 30 (channel) to 30,000 (porous flow) years, providing flow is continuous. Another important aspect is the production of silicate melt as the planetesimal continues to heat. When silicate melt is produced, the porous-flow mechanism of segregation shuts off, unless impacts can produce stresses high enough to trigger deformation at high strain rates. High strain rates can overcome the strength of the silicate mush matrix, and deformation would shift back to fracture (albeit transient) rather than plastic flow.
Contact: Tracy Rushmer
Funded by: ARC Discovery
Figure 1. Numerical result of a simulation of the 2D velocity field made using a geometry in which melt flow is confined largely to a vein formed during sample deformation in the laboratory. Some background matrix flow also takes place. The implication is that this geometry reflects textures likely to dominate in an environment where planetesimals are in frequent collision. For this calculation, matrix permeability = 10-10 m2 using a liquid metal viscosity in vein 10-3 Pa s corresponding to 14 wt% S at T = 1500 K and 1 GPa.
Geological swap meet: transforming geochemical data into geophysical observables in southern Africa

The kaapvaal craton in southern africa is one of the most-studied fragments of Archean crust and mantle in the world. Detailed seismic and geochemical surveys of the craton provide an unprecedented view of this ancient system from different perspectives. However, the question remains: how well do these perspectives agree with one another?
Figure 1. A simplified tectonic map of southern Africa showing the location of the Kaapvaal Craton, the locations of the two sets of kimberlites, and the path of the profiles in
Figures 2 and 3.
The "4-D" lithosphere-mapping methodology developed at GEMOC provides a framework to convert geochemical data directly into seismic data in order to compare these data sets. Lithosphere mapping principles were applied to two sets of peridotitic garnet xenocrysts collected from the heavy mineral concentrates of kimberlites along a transect through southern Africa (Fig. 1). The first set of garnet xenocrysts comes from 33 Group II kimberlites with a median age of ~119 Ma and records the thermal and compositional state of the lithosphere after a long period of quiescence. The second set of garnet xenocysts comes from 31 Group I kimberlites with a median age of ~90 Ma and records major metasomatism and heating of the lithosphere, particularly near the craton margins (for details see GEMOC publication #578).
Using the geochemical information contained in the two sets of garnets, a whole-rock bulk composition was calculated and converted into modal mineral estimates using a Gibbs free-energy minimisation algorithm. Anharmonic seismic velocities were then calculated from pressure, temperature, and mineral elasticity data and corrected for anelastic effects due to grain size, temperature, and seismic wave frequency (see GEMOC publication #521). The seismic velocity images resulting from each set of garnets are shown in Figure 2.

Figure 2. Shear wave velocities calculated from garnet xenocrysts hosted in the older set of kimberlites (bottom panel) and the younger set of kimberlites (top panel). Diamond symbols on the profiles indicate the depth range of garnet data from each kimberlite. The heavy vertical black line indicates the location of the craton boundary as mapped at the surface.
The seismic images echo the changes in the thermal and compositional data described above. Seismic velocities derived from garnets hosted in the older kimberlites are uniformly higher than those from garnets hosted in the younger kimberlites. The reduction in velocity is primarily related to a rising geotherm and thermal disequilibrium at the base of the lithosphere resulting from metasomatic activity preceding the eruption of the second set of kimberlites. Comparison of the garnet-derived velocities with modern seismic observations (Fig. 3) indicates that the localised thermal anomaly causing the low velocities 90 Ma years ago has dissipated to form a broad low-velocity zone between 175 and 250 km depth beneath the Kaapvaal Craton. Ongoing thermal modeling at GEMOC aims to reveal the timing and extent of the thermal perturbation and related metasomatism beneath southern Africa from the Late Mesozoic to the present.
Contacts: Alan Kobussen, Juan Carlos Afonso, Bill Griffin, Sue O'Reilly
Funded by: ARC Discovery, ARC Linkage, DeBeers Exploration, Macquarie University

Figure 3. Seismic tomography model of velocities along the same profile as Figure 2 using modern seismic observations in southern Africa (S. Fishwick, personal communication). The colour scale is the same as Figure 2.
Ancient continental lithospheric mantle beneath oceanic islands – Cape Verde Archipelago
The cape verde islands lie in the atlantic ocean off west africa, in a clearly oceanic setting. The lavas of some islands carry mantle-derived xenoliths of depleted peridotites 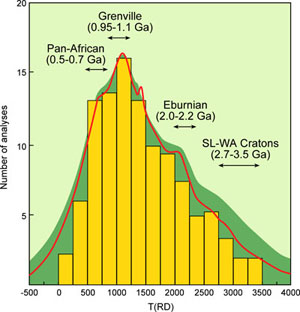 (low in Ca, Al, Fe and other basaltic components), petrologically similar to those derived from cratonic lithospheric mantle. Oceanic lithospheric mantle, in contrast, consists mainly of less-depleted peridotites (lherzolites and harzburgites) formed by the extraction of mid-ocean ridge basalts. In situ Re-Os analyses of individual sulfide grains from depleted xenoliths from the island of Sal yield Re-depletion model ages ranging mainly from Neoproterozoic to Archean. Their age distribution mirrors the tectonic history of the western margin of the West African Craton and the corresponding continental margin of Brazil. These data suggest that part of the Cape Verde Archipelago is underlain by a fragment of ancient subcontinental lithospheric mantle (SCLM), left stranded in the oceanic lithosphere during the opening of the Atlantic Ocean (GEMOC Publication #625). Contamination of magmas by this ancient continental root can explain the unusual isotopic characteristics of some Cape Verde lavas without recourse to recycled continental material in the sources of mantle plumes.
Figure 1. Age histogram (n=135) and cumulative probability plot of TRD (rhenium depletion) age (n=108) for mantle sulfides (after GEMOC Publication #411).
The sulfide Re-Os age data from the Cape Verde mantle xenoliths (Fig. 1) broadly reflect the timing of events characterising the tectonic history of the Atlantic suture, and especially of the West African margin. The oldest Archean ages correlate with the ancient rocks of the West African Craton; the peak around 2 Ga correlates with the Birrimian volcanism and the Eburnian orogeny along the margins of the craton. The major Neoproterozoic peak (ca 1 Ga) matches the collision of the West African and Sao Luis Cratons and related volcanism; the youngest group of ages (550-800 Ma) corresponds to the breakup of the continent along the earlier suture, and the opening of the Iapetus Ocean. The dominance of Neoproterozoic ages is consistent with the position of the Cape Verde Archipelago closer to the inferred former suture between Africa and South America, where pre-existing SCLM would have been most strongly modified.
The broad spread of model ages between ca 1800-1300 Ma (ca 30 % of the data) may reflect either reactions between successive sulfide generations (i.e. mixed ages), or episodic metasomatism of the SCLM. In any case, the existence of possible "mixed ages" requires the presence of an older (cratonic) component. This possibility is also suggested by recent global tomographic mapping which show a high-velocity region below the Cape Verde Archipelago (Fig. 2).
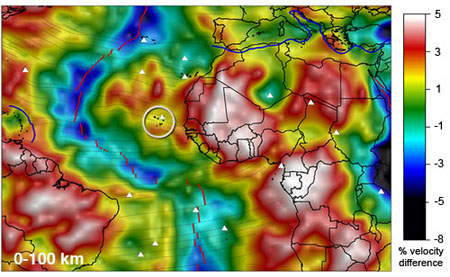
Figure 2. Seismic tomography (Vs) image of northern Africa and the adjacent Atlantic Ocean at 0-100 km (after GEMOC Publication #547) showing high-velocity regions in the ocean basin. (Note colour reversal with hot colours indicating high velocity).
The presence of a domain of Archean-Proterozoic SCLM beneath the Cape Verde Islands suggests that the opening of the ocean basin did not involve a clean break, with generation of new oceanic lithosphere directly overlying the underlying convective mantle. Depleted Archean to Proterozoic SCLM is buoyant relative to the convecting mantle (see GEMOC Publication #228), and detached fragments are thus unlikely to sink; instead they may "surf the convecting mantle" (see GEMOC Publication #411) as the ocean opens. Such fragments of relict SCLM may be widespread in the ocean basins.
We suggest that during rifting, before true oceanic crust has been formed, rising MOR-like melts impregnate the pre-existing SCLM, causing a progressive heating and rheological weakening. A combination of rifting and ductile extension could produce an intermingling of old pieces of SCLM and new oceanic lithosphere. Geological and geochemical studies of the Lanzo peridotite massif (Piccardo et al., Lithos, 94, 181-209) provide a possible analogue. Lanzo may represent a transition between old SCLM and oceanic lithosphere; extending SCLM was modified by magmas, causing a progressive thermo-chemical erosion of the SCLM.
The presence of an SCLM remnant beneath the Cape Verde islands also can explain the complex isotopic signatures of the magmatic rocks. Geochemical signatures typical of ancient SCLM components have been recognised in some lavas on Sal (Holm et al., J Petrology, 47, 145-189) and the interaction of rising magmas (derived from the convecting mantle) with the SCLM could impart these signatures.
If such SCLM remnants are widespread in the ocean basins, they offer an alternative interpretation of the origin of EM1 and EM2 components (geochemical signatures of recycled crust) in ocean-island basalts. Rather than reflecting continental components subducted into the lower mantle and sequestered until tapped by rising plumes, these signatures may simply indicate contamination of rising magmas by relatively shallow SCLM remnants (see GEMOC Publication #576).
The new Re-Os data resulting from this study, coupled with those from abyssal peridotites, suggest that the traditional picture of oceanic lithosphere as the residues of basalt extraction at mid-ocean ridges is probably an oversimplification. Instead, the development of ocean basins may involve disruption of continental lithosphere and incorporation of relict SCLM domains in oceanic regions (Fig. 3). The repeated opening and closing of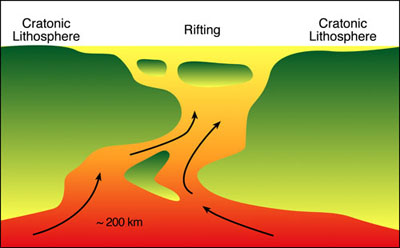 oceans, commonly along older sutures, must have left many SCLM remnants of different ages within the ocean basins. This process will produce significant compositional and geochronological heterogeneity in the oceanic lithosphere over time.
Contacts: Sue O'Reilly, Bill Griffin, Massimo Coltorti, Norman Pearson, Costanza Bonadiman
Funded by: ARC Discovery, Italian Government research grants
Figure 3. Cartoon showing possible oceanic rifting mechanism with listric faulting at cratonic margins and stranding of ancient subcontinental lithospheric mantle remnants in the ocean basin (after GEMOC publication #576).
A translithospheric suture in the vanished 1-Ga lithospheric root of South India
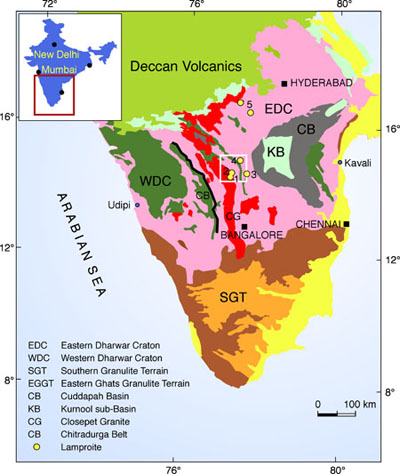
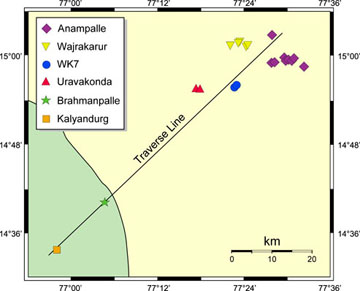
Garnet xenocrysts and eclogite xenoliths from 15 kimberlites (1.0-1.1 Ga in age) have been used to map the composition and structure of the subcontinental lithospheric mantle (SCLM) along an 80-km traverse across the eastern margin of the Closepet Granite in Andhra Pradesh, southcentral India (see GEMOC Publication #567; Fig. 1, 2). The SCLM at the SW end of the traverse is more depleted (abundant harzburgites, mean XMg of olivine ≈93.5, mean whole-rock Al2O3 ≈1.5%) than that at the NE end (fewer harzburgites, XMg ≈ 92, Al2O3 >2%) (Fig. 3). The depleted layer thins from ca 195 km thick in the SW, to ca 170 km in the NE, although geotherms derived from the xenocrysts are similarly low (ca 35-37 mW/m2). The middle of the traverse is underlain by a strongly refertilised SCLM with a higher geotherm (ca 40 mW/m2) and extensive evidence of metasomatism (high Ti, Zr, lower Mg#; Fig. 4). At the SW end of the traverse, the kimberlites contain abundant eclogites; P-T estimates show that these are tightly concentrated in a layer from 175-190 km depth, and coincide with a zone of melt-related metasomatism. In the central part of the section, the eclogites also are abundant, but are distributed through the highly metasomatised section from 90-160 km depth.
Figure 1. Geological sketch map of India, showing the location of the Dharwar craton; box outlines the area shown in Figure 2.
 These data suggest that the kimberlites at either end of the traverse sampled two distinct lithospheric blocks, perhaps coinciding with the Eastern and Western blocks of the Dharwar Craton. The zone of refertilised SCLM between them is interpreted as the cratonic suture, metasomatised by mafic melts (now eclogites). At either end of the traverse, such melts ponded at the base of the SCLM, but they were able to penetrate higher into the SCLM along the ancient suture. If this suture dips 70-80° to the east, its surface outcrop would lie within the area now intruded by the Closepet Granite. The "tilt" of the proposed cratonic suture may reflect overthrusting of the Eastern Dharwar Craton crust up to 100 km to the west.
Figure 2. Locations of kimberlite clusters studied. Pale green indicates outcrop area of the Closepet Granite.
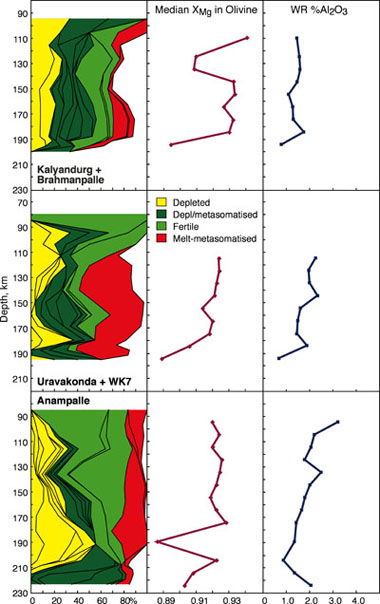
Figure 3. Chemical Tomography sections, illustrating the vertical distribution of geochemical signatures in peridotitic garnets. The mean XMg of coexisting olivine and the mean whole-rock Al2O3 content are calculated from garnet data.
Recent geophysical data (seismic, MT) suggest that the depleted lithospheric root beneath the Dharwar Craton that was sampled by the 1.1 Ga kimberlites is no longer present. The removal or major modification of this root could have occurred during the breakup of Gondwanaland, and may help to explain India's rapid northward drift before it collided with Asia. India thus joins the North China Craton as an example of the destruction of an Archean continental keel.
Contacts: Bill Griffin, Sue O'Reilly, Alan Kobussen
Funded by: ARC Discovery, MQRESIndia


Figure 4. Lithosphere mapping. Diamonds, individual data points. Circles, eclogites (numbers show >1 sample with similar depth estimate). Contour filtering blocks are 20 km wide by 5 km deep. (a) Median calculated XMg of olivine coexisting with Cr-pyrope garnets. (b) Distribution of Ti in peridotitic garnets. (c) Distribution of Zr in peridotitic garnets.
Metasomatic hide and seek: Origins of the Roberts Victor eclogites
Eclogite (the high-pressure metamorphic equivalent of mafic rocks such as basalt) is an important constituent of the subcontinent lithospheric mantle (SCLM) although its abundance is low (1-3 vol%). A clear picture of its origin will help us to understand the origin of the ancient SCLM, one of the key questions in Earth Sciences. Extensive studies of these rocks have generated two contradictory hypotheses about their origin; one regards eclogites as deep-seated magmatic rocks, while the other regards them as components of subducted oceanic slabs. Eclogite xenoliths are very abundant in the Roberts Victor kimberlite in South Africa, and previous studies have provided many observations and analyses. These provide a basis for a new approach to the "eclogite problem", using a large collection of samples housed at GEMOC. 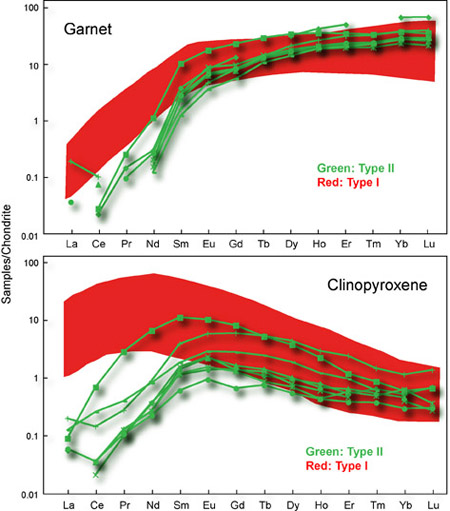
The Roberts Victor eclogites can be divided into two types based on differences in microstructure and mineral composition; the abundance of Type II is low, about a quarter of Type I. Type II eclogites have low Na in gnt and low K in cpx, while Type I have high values. Type II eclogites are generally fresh and show equilibrated microstructures. Rutile exsolution in gnt and cpx, and gnt exsolution in cpx, are only found in Type II eclogites. Type I eclogites, in contrast, are not in textural equilibrium, have many fluid inclusions and contain altered cpx. Only Type I eclogites contain diamond, graphite, sulfides and apparently-primary phlogopite.
Figure 1. Chondrite-normalised rare earth element patterns for garnet and clinopyroxene from Type II (green lines) and Type I (red areas) eclogites from Roberts Victor mine.
All the minerals are homogenous within each sample. The depth of each sample was estimated by projecting the P-T locus calculated from the gnt-cpx thermometer to the local geotherm derived from peridotitic xenoliths and garnets. Type II eclogites are homogeneously distributed from 170-200 km depth, but Type I are strongly concentrated in a layer at 180?-?190 km depth, just beneath the lithosphere-asthenosphere boundary (180-200 km).
Reconstructed whole-rock compositions show that Type I eclogites are richer in Mg and K than Type II; there are also significant differences in trace-element patterns between the two types. Type II garnets have higher mean ΣREE than those of Type I, but Cpx from Type II has lower REE concentrations than those from Type I, and ΣLREE/ΣHREE is much lower (Fig. 1). O- isotope ratios also show differences between the two types of eclogites. Type II eclogites have δ18O < 4.3‰ and those of Type I have mantle values (ca 5.4) or higher (Fig. 2).
Sr, Nd and Hf isotopes of gnt and cpx were analysed in small acid- leached grains. Although Eu anomalies are absent or very small in gnt and cpx (Fig. 1), they are pronounced in the leachates from both phases in both types of eclogites. Previous reports of Eu anomalies in such eclogites probably represent contamination on grain boundaries or in cracks within the minerals.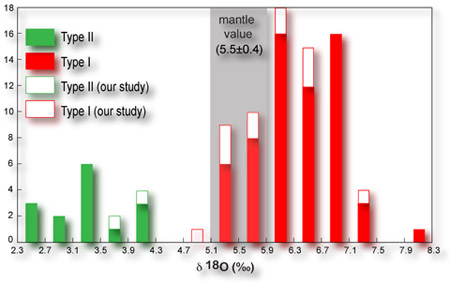
Figure 2. O isotopic compositions of Type II and I eclogites from Roberts Victor mine. Solid squares are the data from MacGregor and Manton,1986; Ongley et al.,1987; Jacob et al., 2003 and Schulze and Helmstaedt, 1988; Open squares are the data from our study.
The Nd-Hf data for Type I eclogites define two-point isochron ages (Sm-Nd 127±21 Ma; Lu-Hf 128±13 Ma; Fig. 2) that are identical to the kimberlite eruption age (128 Ma). Lu-Hf isochron ages for three Type II eclogites (1354±9 Ma; Fig. 3) may suggest a connection to the Namaqua-Natal Orogenic Belt south of the Kaapvaal Craton; other Type II eclogites show more obvious partial re-equilibration. These differences immediately suggest that Type II eclogites have retained their initial isotopic compositions (modified by radioactive decay) whereas the isotopic systems of the Type I eclogites were actively re-equilibrating at the time of their entrainment in the kimberlite. This is consistent with the petrographic and mineralogical evidence of fluid metasomatism in the Type I eclogites. Initial isotopic ratios at the time of kimberlite eruption also show marked differences between Type II and Type I; initial 87Sr/86Sr is 0.7060-0.7064 in Type I and 0.7013-0.7030 in Type II. 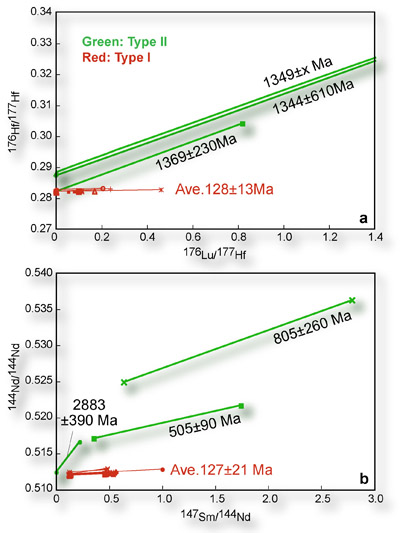
These data and observations, combined with the detailed study of sulfide minerals suggest that Type I eclogites were being actively metasomatised at the time of the kimberlite eruption. Inter-element correlations suggest that the metasomatism was adding Mg, K, Na, Ti, S, C (diamonds) and LREE. Some samples from the same depth range (the present Type II eclogites) appear to have escaped this process and preserved their original characteristics.
The calculated fluid in equilibrium with Type I eclogitic gnt and cpx is LREE-enriched and shows trace-element patterns similar to those of fibrous diamonds and carbonatitic/kimberlitic melts. The Sr- and O-isotope values are also consistent with reaction between Type II eclogites and carbonatitic melt (typical δ18O ≈ 6 - 7; 87Sr/86Sr ≈ 0.706 -0.707) to form Type I eclogites. Type II eclogites therefore are the key samples for studying the origin of this eclogite suite, since they may represent the protoliths. Type I, in contrast, are heavily metasomatised rocks, and retain little evidence of their primary origin.
Contacts: Jinxiang Huang, Yoann Greau, Bill Griffin, Sue O'Reilly
Funded by: ARC Discovery (O'Reilly and Griffin), MQRES, EPS Postgraduate Fund
Figure 3. Garnet-clinopyroxene Lu-Hf (a) and Sm-Nd (b) isochron ages of Type II (green line) and Type I (red line) eclogites from Roberts Victor mine.
Dating problems with ancient perovskites rescued by SIMS

Kimberlites, our main source of natural diamonds, are notoriously difficult to date, because they are chaotic mixtures of foreign mineral and rock material, enclosed in a (usually altered) magmatic matrix. Perovskite (CaTiO5) grains in the groundmass of kimberlites are usually interpreted as having crystallised from the kimberlite during its rapid cooling after emplacement in the shallow crust. The perovskites have high contents of uranium, and potentially can be used to date the emplacement of the kimberlite by U-Pb isotopic analysis. This approach could avoid the complications of inheritance or mixed ages associated with traditional zircon and mica dating methods. The drawback to perovskites is that (unlike zircon) they also soak up lead ("common Pb") from the magma, so that they contain a mixture of common Pb and radiogenic Pb produced by the decay of U and Th, which complicates the dating.
Figure 1. U-Pb inverse-Concordia diagrams showing (a) the typical example of kimberlitic perovskite dating using the in situ LAM-ICP-MS method, example from the X007 kimberlite; (b) U-Pb inverse-Concordia diagram from the Helpmekaar kimberlite.
In recent years the use of laser ablation microprobe-inductively coupled plasma mass spectrometry (LAM-ICPMS) U-Pb analysis to date kimberlitic perovskite has become increasingly popular (see 2009 Annual Report). It can provide very precise ages in a fraction of the time used by other techniques, allowing its widespread application. For these analyses, it is assumed that perovskite is concordant in the U-Pb system. A linear regression is calculated through the data points; the upper intercept of this line with the Concordia curve on a Tera-Wasserburg plot (Fig. 1) gives the common-Pb composition and the lower intercept gives the inferred crystallisation age (Fig. 1a).
This procedure works well as long as the data points show sufficient spread in U/Pb ratios and common-Pb contents to define a line. If this is not the case, a common-Pb correction is required for each analysis. In TIMS (thermal ionisation mass spectrometry) or SIMS (secondary ion mass spectrometry, or "ion-probe") analysis this can be done by measuring the abundance of the non-radiogenic isotope 204Pb, assuming an isotopic composition for the common-Pb component, and subtracting the calculated common-Pb abundance from the analytical data. However, the LAM-ICPMS method cannot accurately measure the 204Pb contents due to an interference with 204Hg in the Ar carrier gas. This problem became apparent during our attempts to obtain more precise emplacement ages for some old kimberlites, in the Kuruman field of South Africa.
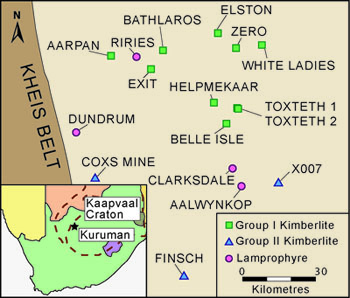
Figure 2. Map showing the location and petrographic classification of the Kuruman kimberlite province.
The non-diamondiferous Kuruman Kimberlite Province is comprised of 16 small pipes and dikes that were intruded across the western edge of the Archean Kaapvaal Craton (Fig. 1). Despite being recognised as some of the oldest kimberlites in the world (~1.6-1.7 Ga), there are only limited geochronological data for the Kuruman Province. Unfortunately, the Kuruman perovskites are relatively homogenous in terms of U and common-Pb contents, which results in a limited range of data points on the Concordia plot. Furthermore, the Kuruman perovskites commonly show evidence of mild, fine-scale alteration and LAM-ICPMS U-Pb analyses of these grains typically scatter results to younger discordant ages. Regression of such data results in large errors in the lower-intercept ages and unrealistically low upper-intercept common-Pb compositions (Fig. 1b). As such, for the Kuruman perovskites, a common-Pb correction is required for each analytical spot.
This may suggest that perovskite is not as resistant to weathering and alteration as was previously thought and that the U-Pb isotopic system in perovskite may be reset by alteration. The LAM-ICPMS analysis uses volumes ca 30 microns across and 30-40 microns deep, and we suspected that the analysed volumes were including altered material, even if the grains looked good on the surface. An alternative approach clearly was required, and was made possible by our collaborator (Jin-Hui Yang) in the SIMS lab at the Chinese Academy of Sciences, Beijing.
The application of SIMS to U-Th-Pb perovskite geochronology has been relatively limited. However, recent developments in calibration protocols using well-characterised standards (see Li et al., Chemical Geology, 269, p. 396-405, 2010) have allowed the smaller analytical sampling volume used by SIMS to be combined with precise measurements of 204Pb, providing a promising tool for detailed in situ perovskite geochronology.
Perovskites from the Kuruman kimberlites were re-analysed using SIMS to target only the most pristine parts of each grain and the results were then corrected for 204Pb. The Bathlaros kimberlite yielded a 206Pb/238U age of 1594±27 Ma (n=7; MSWD=0.22; Fig. 3a); this is younger than the 1694± 42 Ma phlogopite isochron age, upon which the age of the Kuruman Province is currently defined. The Elston (Fig. 3b) and Helpmekaar (Fig. 3c) kimberlites have 206Pb/238UU perovskite ages within error of each other at 1689±26 Ma and 1651±21 Ma, respectively. The Zero kimberlite yielded an older emplacement age of 1832±37Ma (Fig. 3d). The SIMS results thus show a considerable range (~200 Ma) in emplacement ages within the Kuruman Province and reveal a previously unrecognised trend of increasing kimberlite age from east to west across the Province.
The recent LAM-ICPMS dating of kimberlite perovskite has produced many precise and apparently accurate ages, but these have all been from relatively young kimberlites (≤1 Ga; GEMOC publication #505; Wu et al., 2010, Lithos, 115, 205-222). The failure of this method in the case of the Kuruman kimberlites, even when "unaltered" grains were analysed, suggests that the U-Pb system in older perovskites may be disturbed by metamictisation – the breakdown of the crystal structure under α-particle bombardment as U and Th decay – as is seen in many zircons.
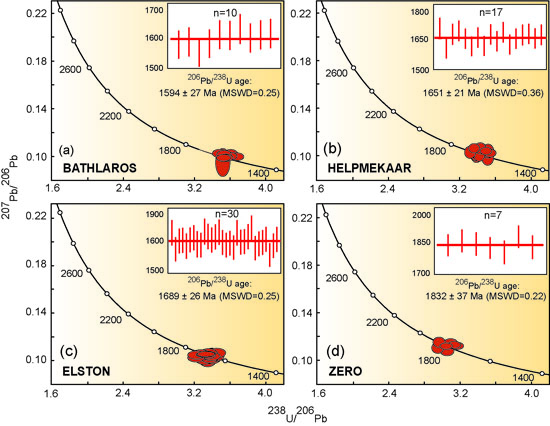
Figure 3. U-Pb inverse-Concordia diagrams for the Kuruman kimberlites obtained using HR-SIMS data.
Contacts: Cara Donnelly, Bill Griffin, Sue O'Reilly, Jin-Hui Yang
Funded by: ARC Discovery (O'Reilly and Griffin), MQRES, EPS Postgraduate Fund, Industry
Short-lived isotopes reveal off-axis magmatism at the East Pacific Rise
More than 70% of global volcanism consists of basalts erupted at mid-ocean ridge ridges (MORB) and this is generally thought to be confined to a narrow axial zone due to efficient magma focusing from a much broader, triangular melting volume. However, the dynamics of melting and melt transport remain a subject of debate. In this regard, studies of short-lived U-series isotopes have proven especially useful because of their potential to constrain melting rates and melt extraction porosity.
One of the most intensively studied ridges is the fast-spreading (11.1 cm/yr) East Pacific Rise (EPR) which appears to be underlain by axial magma chambers. The EPR axial summit trough is only 10-100 m wide, yet geophysical surveys indicate that the oceanic crust continues to thicken (by a factor of ~ 2) away from the ridge axis. This demands the occurrence of off-axis magmatism either by intrusion or by volcanism. This inference has been supported by observations from submersible vessels, and by earlier U-series dating that yielded ages younger than those predicted by combining the distance of the sample from the axis with the local spreading rate. For example, in the region 9-10°N, U-series data demonstrate the persistence of volcanism up to 4 km from the ridge axis.
In order to explore these substantial matters further, we have undertaken U-series analyses of samples from traverses across the EPR at 9°30'N, 10°30'N and 11°20'N. The results show that about 50% of the 34 samples analysed must have erupted off-axis and at least 14 formed within a few km of their current position. Thus, the data confirm geophysical suggestions that magmatism extends significantly off axis (up to 30-50 km). The implication is that magmatism is not as efficiently focused 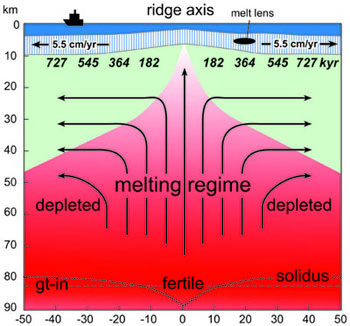 beneath the ridge as is generally believed. There is a decrease in "primary" U-series disequilibria in samples inferred to have formed off-axis and simple modeling suggests that this can be explained by a decrease in melt-column length and fertility as the overlying lithosphere thickens with age (Fig. 1).
Contact: Simon Turner
Funded by: ARC Discovery
Figure 1. True-scale illustration of the melting model explored in light of the East Pacific Rise traverse data, showing schematic mantle flow lines. The oceanic crust thickens away from the ridge axis following the thermal plate model (age is given in italics). Shown are the location of the spinel to garnet transition and the melting region that is required to dip into the garnet peridotite zone on the basis of the large 230Th excesses observed in erupted lavas. It is also assumed the melt extraction in the central upwelling region results in more depleted peridotite moving away from the axis. The location of a melt lens identified from seismic observations is also shown. Ship not to scale.
Apatite trace element fingerprints reveal Transhimalayan magmatic processes
Accessory minerals, though tiny and sparse, concentrate specific geologically-interesting trace elements such as rare earth elements and can give critical constraints on the details of igneous processes in magma chambers. This approach provides information about igneous petrogenesis that is not accessible through conventional bulk-rock analysis. Apatite, although less intensively studied than zircon, may be the next candidate for such expanded applications. In terms of its common occurrence, stability during magma evolution and chemical diversity, apatite is comparable with zircon and even better in some respects.
 A (collision-type) adakite from Zedong, southeast of Lhasa.
To get a better idea of the relationships between magmatic processes and the geochemical characteristics of apatite, we have analysed minor- and trace elements in apatites from a range of plutonic rocks in the Lhasa terrane of southern Tibet. The Lhasa terrane consists primarily of Paleozoic to Mesozoic sedimentary rocks, intruded by ubiquitous igneous rocks. These may be categorised into three principal rock types on the basis of geochemistry and/or occurrence: (1) S-type granites, (2) I-type Gangdese granitoids, (3) (collision-type) adakites, with uniquely high Sr/Y ratios and heavy-REE depletion.
View of the Lhasa terrane, Wuyu, Nanmulin County, northeast of Xigaze.
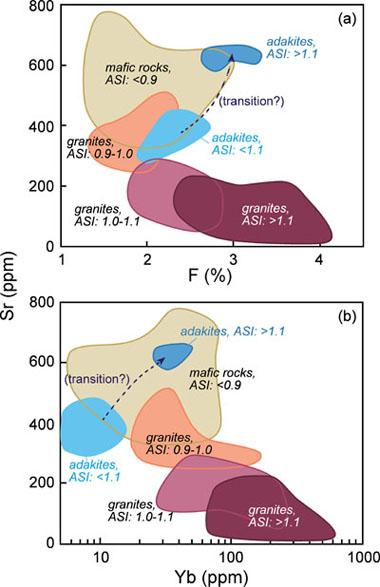
Apatite retains geochemical information about the host magma through the course of magmatic evolution: F, Mn, Sr and rare earth elements in apatite systematically vary with the composition of its host magma and thus have high potential as petrogenetic tracers. More specifically, F and Mn contents in apatite can be used as an indicator of magma aluminium content or differentiation index. Combined with Sr and REE data, which also show significant variations in apatite from different rock types as well, these elements are useful for constructing "discrimination diagrams" (Fig. 1). The variations of Sr and REE in apatite with bulk rock aluminium content reflect competition with other major and accessory minerals in silicate melts, including plagioclase and monazite. These variations therefore are useful for more detailed investigations of petrogenetic processes such as fractional crystallisation and magma mixing (see GEMOC Publication #609). Magma mixing is signaled by inconsistent Eu anomalies, Sr abundances and REE patterns relative to bulk rock composition.
Contacts: Mei-Fei Chu, Norman Pearson, Bill Griffin, Sue O'Reilly
Funded by: ARC Discovery
Figure 1. Two examples of "discrimination diagrams." (a) F and (b) heavy REE, e.g. Yb, abundances in apatites generally increase with aluminosities of host plutonic rocks, e.g. the aluminum saturation index (ASI; molecular Al2O3/(Na2O+K2O+CaO). In host rocks of similar aluminosity, apatite from an adakite has higher Sr and lower heavy REE than one from a granite.
The Gawler Craton, South Australia: Unexpected discoveries and mysteries
Zircon grains from modern and ancient drainages of the gawler 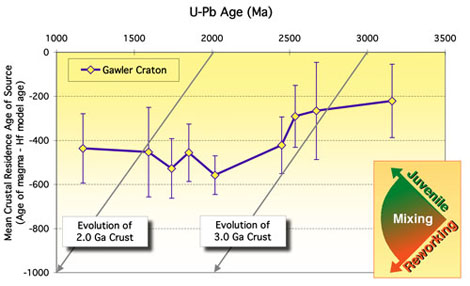 craton, South Australia have been studied to unravel the evolution of this craton. The study has defined the relative contributions of juvenile sources and recycled crust to magmatic activity as a function of time, and constrained the role of mantle inputs during the Proterozoic rejuvenation of the Archean Gawler Craton (see GEMOC Publication #600).
Figure 1. 'Event Signature' curve for the Gawler Craton; mean magma source residence time (Age - TDM) is plotted against time. The mean crustal residence time is given by the age of the given event peak minus the mean TDM model age for that peak.
The integration of Hf-isotope data with U-Pb age spectra showed that the crustal evolution was dominated by long periods of crustal reworking, and that crust generated in the Paleoarchean (3.2–3.5 Ga) was largely reworked during Proterozoic time (Fig. 1). There were three periods with some juvenile mantle input at ca 2540 Ma, 1853 Ma and 1595 Ma. However, these juvenile mantle inputs provided a minor contribution to the crustal volume, compared to the major role played by the reworking of older crust.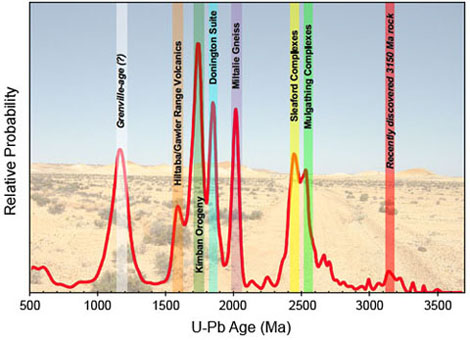
Figure 2. Relative probability plot of U-Pb age data for zircon from the Gawler Craton.
Modelling of the composite age spectrum derived from the detrital zircons allows definition of six major geological events in the Gawler Craton, spanning the period 2550-1550 Ma (Fig. 2). Besides those previously well-recognised events, we identified a minor age peak at ~3152 Ma. This Archean age is also strongly supported by Hf-isotope data – many zircons have model ages ca 3.2 Ma. This conclusion was later confirmed by the Geosience Australia discovery of the oldest rocks reported from the Gawler Craton; an outcrop in the Eyre Peninsula has been dated to 3150 Ma.
We also found a major peak at 1169 ± 48 Ma represented by a prominent zircon population (Fig. 2). This appeared to be the only event that had not been reported previously in the Gawler Craton and is a mystery remaining to be resolved. There is a possibility that this age population might represent zircons that were transported from the Musgrave Province, where a Grenville-age event is well documented. However, zircons of this age are found not only in the samples from drainages situated near the Musgrave Province, but across the Gawler Craton as far as the Gawler Range Volcanics Domain and the southern part of the Olympic Domain, over 700 km SE of the Musgrave Block. Moreover, other age populations, and especially the 1300-1400 Ma event that is prominent in the Musgrave Province, are not found in the Gawler samples. This observation alone makes it improbable that the 1169 Ma age population is derived from the Musgrave province. Further investigations to find rocks of this age within the Gawler Craton will be necessary to resolve this ambiguity.
Contacts: Elena Belousova, Bill Griffin, Sue O'Reilly
Funded by: PIRSA, ARC Linkage

TerraneChron® sampling in the Gawler Craton
Zircons lay bare the secrets of the ancient Yangtze Block
The yangtze craton of south china is usually regarded as a Proterozoic block with minor Archean remnants, but this interpretation is based mainly on inference, because most of the craton is obscured by much younger sediments. However, there are several late Proterozoic basins lying around the edge of the craton, and the detritus in these is believed to be derived from its now-covered interior. A Nanjing University- GEMOC collaboration has been investigating these basins, using integrated U–Pb dating, Hf-isotope and trace-element analysis of detrital zircons to identify ancient crustal remnants and the provenance of clastic sediments, and to provide an overview of crustal evolution in the now-covered parts of the Yangtze Block. 
Figure 1. Probability density plots comparing U-Pb ages for detrital zircons.
The Fanjingshan and Xiajiang sediments in the southeastern part of the Yangtze Block have been studied during 2009. The zircon dating indicates that the Fanjingshan Group, which previously was regarded as 870 Ma old, actually was deposited in a ~800 Ma rift basin similar to other contemporaneous basins in the Yangtze Block. The regional unconformity separating the Fanjingshan Group from the overlying Xiajiang Group is dated to 800~740 Ma and is probably related to rifting processes during the breakup of Rodinia (830~740 Ma).
Detrital zircons from these two sedimentary groups have different age populations. We have identified seven main age populations in the Fanjingshan Group: 0.85~0.8 Ga, 0.95~0.86 Ga, 1.3~1.1 Ga, 1.6~1.5 Ga, 1.8~1.7 Ga, 2.1~2.0 Ga, 2.4 ~2.2 Ga and 2.6~2.5 Ga. There are fewer age peaks in the Xiajiang Group: ~760 Ma, ~800 Ma, ~880 Ma, ~2000 Ma and ~2500 Ma (Fig. 1).
The trace-element analysis indicates that most zircons in the Fanjingshan Group were derived from granitoids, with a few from mafic rocks. However, the dominant source rock of zircons from the Xiajiang Group changes from the lower to the upper part of the group. The proportion of mafic rocks increases upward through the sequence, suggesting bimodal magmatism in the region.
Based on the zircon U-Pb dating and Hf-isotope results for the Fanjingshan and Xiajiang groups, the distinguishing features of Precambrian crustal evolution in their respective source regions are summarised in the Event Signature curves of Figure 2a. They have similar Archean origins. The oldest continental crust in the Yangtze Block may have started to form in early Archean or even Hadean time. A previously unrecognised source (~4.3 Ga) is suggested by the Hf model ages of the oldest zircons. During late Archean time (2.4~2.6 Ga), some juvenile material was added to the crust in the source areas for both the Fanjingshan and Xiajiang groups. After this time the two source regions have followed different evolutionary paths.
In the source regions of the Fanjingshan Group, the juvenile Archean crust was reworked during Paleoproterozoic time (2.1~1.7 Ga). An important input of juvenile mantle-derived material occurred in the early Mesoproterozoic (1.6~1.4 Ga). This is the first documentation of early Mesoproterozoic juvenile crust in South China. Afterwards, both reworking and some juvenile growth of crust took place from Mesoproterozoic (~1300 Ma) to mid-Neoproterozoic (~800 Ma) time.
In the source area of the Xiajiang Group, the Archean crust was reworked in Paleoproterozoic time (2.0-2.1 Ga), but the 1.6-1.4 episode is essentially absent. The most significant input of juvenile crust occurred in early Neoproterozoic time (850~1000 Ma). This episode of juvenile-crust formation was followed by crustal reworking until ~800 Ma. The last magmatic activity in this area involved a new juvenile contribution at 790~740 Ma. The curves show that crustal evolution of the source area of the Xiajiang Group is quite similar to that of the Yichang area reported by Liu et al. (2008; AJS, 308, 421-468).
The possible source areas for these sedimentary rocks are the Yangtze Block and the adjacent Cathaysia Block (Fig. 2b). Although similar mid-Neoproterozoic and Paleoproterozoic age populations (0.85~0.8 Ga, 1.8~1.7 Ga) are found within both the Yangtze Block and the Cathaysia Block, the detrital zircon spectra in this study show remarkably little material of Grenvillian age (0.95~1.0 Ga) whereas rocks of this age are abundant in the Cathaysia Block. The crustal event signature summarised in Figure 2b shows a different geological evolution than the one recorded by the zircons studied here (see GEMOC Publications #615 and 477). The euhedral morphology of zircons in all age windows from the Fanjingshan and Xiajiang sediments also suggests that their primary sources were not far from their site of deposition. Therefore, the (now unexposed) Yangtze Block is considered to be the main source for the sediments in the Fanjingshan and Xiajiang groups. The differences in the sources for some detrital material between these two groups, and with exposed basement in the Yangtze Block that the sources for these zircons lie within different, now-covered, parts of the Yangtze Block.
Contacts: Lijuan Wang, Sue O'Reilly, Jin-Hai Yu
Funded by: ARC Discovery (O'Reilly and Griffin), MQRES, EPS Postgraduate Fund
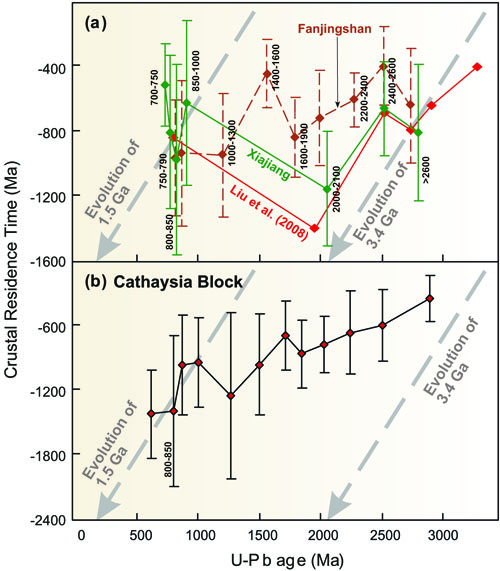

Figure 2. "Event signature" curves combining zircon ages with calculated crustal model ages for the study area, the Yichang area (Liu et al., 2008) and Cathaysia Block (Yu et al., 2009; Xu et al., 2007). Crustal residence time is the time between the separation of the source from the Depleted Mantle and the crystallisation of the zircon. In this plot, an upward trend with decreasing age indicates juvenile input, while a downward trend implies reworking of older crust.
Platinum-group elements nobly unravel komatiites
Platinum-group elements (PGE: Ru, Rh, Pd, Os, Ir, Pt) are important as petrogenetic tracers in the study of Earth's accretion history, core-mantle interaction, mantle differentiation processes, and the Re-Os isotopic system that is widely used to date mantle depletion events. They are industrially important commodities in their own right, and have been identified as potential pathfinders for Ni-Cu-sulfide mineralisation. However, owing to their low abundance and complex behavior, PGEs remain among the least understood elements in geochemistry, mainly because of the difficulties of producing accurate and precise analyses. Research at GEMOC has developed novel analytical approaches for low-level PGE analysis in order to investigate the behaviour of PGEs during the fractionation of komatiites and komatiite-derived magmas, with a particular focus on the role of chromite in the fractionation and concentration of Ru.
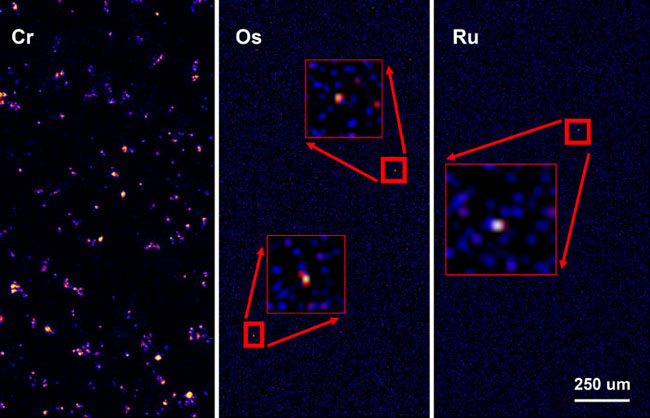
Figure 1. X-ray fluorescence maps showing the distribution of Cr Ka (as an indicator of chromite), Os and Ru in a komatiite. The maps were obtained using a beamline on the Australian Synchrotron.
In sulfide-saturated systems, the behaviour of the strongly chalcophile PGE is well established; it is dominantly controlled by their strong partitioning into sulfide melts relative to silicate magmas. However, little is known about the fractionation of PGEs in sulfide-undersaturated systems, mainly because the PGE contents of mineral phases that record the magmatic evolution of a system are generally below the detection limit of conventional analytical techniques. Accordingly, most studies have been limited to using whole-rock 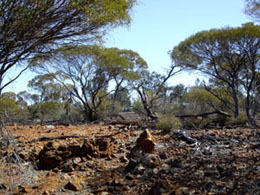 PGE signatures from S-poor rocks. Although this gives a rough idea about the PGE behavior, it leaves a lot of questions unanswered, particularly as primary magmatic whole-rock signatures can be overprinted by metamorphism, alteration, and weathering. Moreover, the presence of minute platinum-group minerals can distort the whole-rock PGE signatures of S-poor rocks (Fig. 1).
Archean lava lake outcrop from Kurrajong, Western Australia.
A more informative way to investigate PGE behaviour is to determine the PGE signatures and/or concentrations of primary mineral phases as these signatures are less likely to be overprinted by secondary processes. However, it has been widely debated over the past decades if PGE can exist in solid solution in non-sulfide phases at all, or if measured PGE concentrations in oxides and silicates are exclusively related to the presence of inclusions. This needs to be established, as only PGE in solid solution will record the evolution of a magmatic system, and therefore can be used to better understand the behaviour of PGE during fractionation.
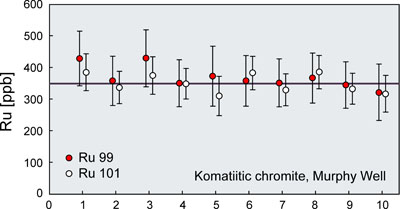
Figure 2. Ruthenium in chromite from the Murphy Well komatiite flow in Western Australia as analysed by laser ablation ICP-MS. The solid line shows the average Ru concentration obtained by Carius-tube digestion and isotope-dilution ICP-MS analysis and confirms the accuracy of the in situ studies.
The analytical approach for low-level PGE analysis in mineral phases at GEMOC combines (1) in situ laser ablation (LA) ICP-MS analysis of chromite and silicate grains to determine PGE concentrations at ow ppb levels and the spatial distribution of PGE within the grains; and (2) Carius-tube digestion and isotope-dilution ICP-MS analysis of mineral concentrates to confirm the accuracy of the in situ studies. The study has demonstrated that Ru can exist in solid solution in chromite with concentrations up to several hundred ppb and that the fractionation of Ru in S-poor systems is controlled by the crystallisation of chromite. The laser ablation ICP-MS data show that Ru concentrations in chromite grains in individual samples are, within analytical uncertainty, the same on sample- and grainscale (Fig. 2). These results suggest that Ru is bound as solid solution in the crystal lattice of chromite, as the occurrence of Ru-bearing micro-inclusions would produce a greater variability within and among grains of the same sample. This hypothesis is supported by the fact that time-resolved LA-ICPMS analyses show a uniform distribution of Ru in komatiitic chromite indicated by a constant signal intensity of approximately 40-50 cps above background, whereas it was possible to establish the presence of Ir-inclusions distinctly smaller than 1 μm using the same analytical procedures (Fig. 3). This indicates that the absence of Ru-bearing micro-inclusions in the analysed chromites is a real feature and not the result of sampling bias. It could be argued that Ru may 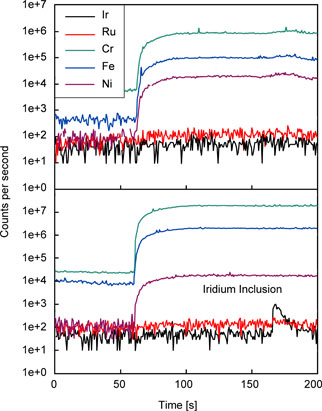 be evenly distributed as nano-particles in chromite – and not necessarily bound in the crystal lattice as solid solution. However, our data give similar results for many samples from different localities. If Ru was hosted as nano-particles rather than being in solid solution, a greater variability would be expected. Therefore, we suggest that Ru can exist in solid solution in chromite with concentrations up to several hundred ppb.
These outcomes are the first of their kind and open up new avenues of research related to the role of chromite in the fractionation and concentration of Ru in mafic and ultramafic systems.
Contacts: Marek Locmelis, Norman Pearson
Funded by: ARC Discovery (O'Reilly, Griffin and Pearson), MQRES, EPS Postgraduate Fund
Figure 3. Time resolved analysis record obtained by LA-ICP-MS illustrating (A) the absence of any PGE-bearing micro-inclusions in chromite from Murphy Well, and (B) the presence of an iridium-bearing micro-inclusion in a chromite grain from a komatiitic basalt flow at Collurabbie (Western Australia).